Read a qEEG Brain Map
Quantitative Electroencephalography (qEEG) is a non-invasive diagnostic technique used to examine the activity of the brain. The technique uses electrodes placed on the scalp to detect electrical signals sent by the brain. Once the signal has been captured, the EEG is analyzed and the results are presented as colored maps. These maps show areas of the brain that are functioning correctly, and areas that are malfunctioning.
qEEG Brain Map is often used in the diagnosis of certain disorders, including schizophrenia, major depression, obsessive-compulsive disorder, and early dementia. It can also be used to identify symptoms and provide treatment. For example, a 23-year-old man who has difficulty paying attention is being trained to improve his ability to focus. His QEEG map shows that his brain is using too much slow speed in his Frontal Lobe.

In order to read a qEEG map, you first need to know what a qEEG is and how it works. This technology is used to analyze brain wave patterns to identify if they are within normal limits or are abnormal. A qEEG map can help to determine if a symptom is neurologically linked and can help to identify any imbalances that may be causing a problem.
How to Read a qEEG Brain Map
During a qEEG session, the patient wears an ear clip and a special cap on his or her head. These electrodes receive the electrical signals from the brain and send them to a computer. An expert will then read the results. After reviewing the results, the clinician will have a better understanding of the problems the person is experiencing and develop a treatment plan.
Typically, the time needed for a qEEG session is about thirty to forty-five minutes. During this time, the patient will sit in a comfortable chair with his or her eyes open. If necessary, the technician will allow the patient to take a break.
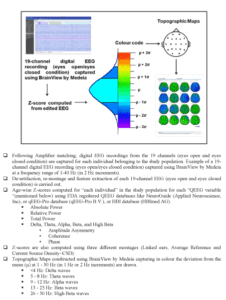
The QEEG map will be compared with the normal distribution of brainwaves found in the normative database. Among the different types of data that can be gathered from a qEEG are relative power values and z-scores. Z-scores are positive if the person has excess activity, and negative if the person has deficit activity. Red arrows indicate areas of increased or decreased activity. Green arrows indicate a normal level of activity.
During a qEEG, the patient must remain as calm as possible. Since the brain can be quite noisy, a qEEG technician will give the patient breaks throughout the test. When a break is taken, the technician will inform the patient of the time as it goes by.
During the qEEG, the patient will sit in a comfortable seat for about six minutes. While the QEEG technician is doing the test, he or she will be collecting up to 20 minutes of EEG data. At the end of the test, the patient will be given a report of the analysis of each lobe of the brain. The report will include hundreds of measurements and will be reviewed by a doctor.